Report: Number of people signed up for all presentations

How it’s used:
• This report gives you an overview of the number of sign-ups for each presentation at your event.
• You can run this report at any time before your event, to get a sense of overall demand and see which presentations might need more promotion.
In this article:
Running the report
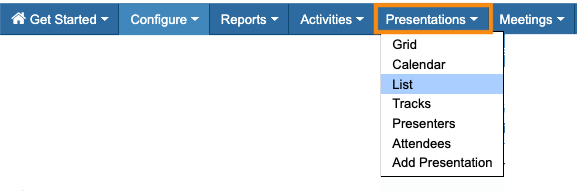
- Step 1. Head to the Presentations tab. Choose List:
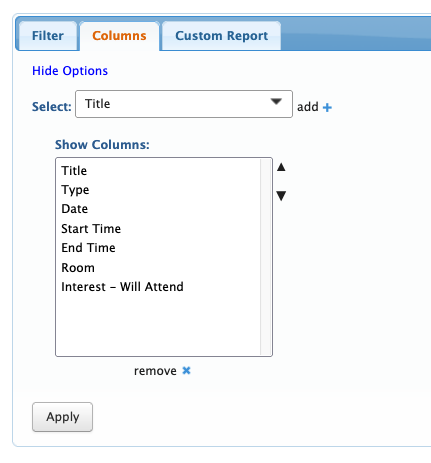
- Step 2. Now, head to the Columns tab. Here, you can add or remove columns. Click Apply to save the changes.
- We recommend using these columns as a starting point:
- • If your presentations have breakout sessions afterward, you might want to include the Breakout Start, Breakout End, and/or Breakout Room columns.
- • If you have multiple tracks of presentations, you might want to include the Track column.
- Step 3. You’ll now have an overview report of all of your presentations, along with the total people signed up for each one.
- If you need to narrow this report a bit more, the Filter menu has a few options:

Exporting the report
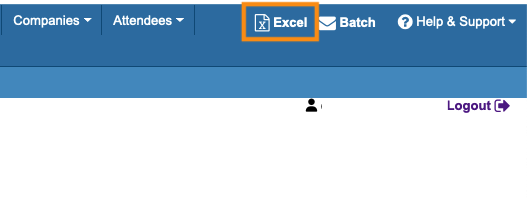
To export the report in spreadsheet form, head to the top right corner of the page. Click Excel.
You can open the exported file in any spreadsheet software:
Saving the report
Want to save this report so you can quickly access it later?
Head to the Custom Report tab. Choose New from the menu.
Then give the report a title, choose whether to share it with your team, and click Save: