In this article:
- Where is it?
- Customizing the display
- Saving custom reports
- Using the Presentation List
- Using the Presenter List
- Exporting lists
Where is it?
You’ll find both lists in the Presentations tab:

- List: Shows you all presentation sessions, each on one line.
- Presenters: Shows you all presenters. A presentation with three presenters will have three lines on this list.
Customizing the display
As with all lists in MeetMax, you can create exactly the report you need, and save it as a custom report to reference later.
Filtering
Use the Filter tab to narrow the list to specific entries:

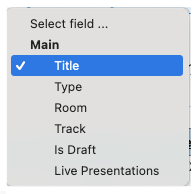
In the example above, we’re filtering by presentation title, but you can filter by other criteria (shown below). You can even combine several filters to get more precise results:

Adding or removing columns
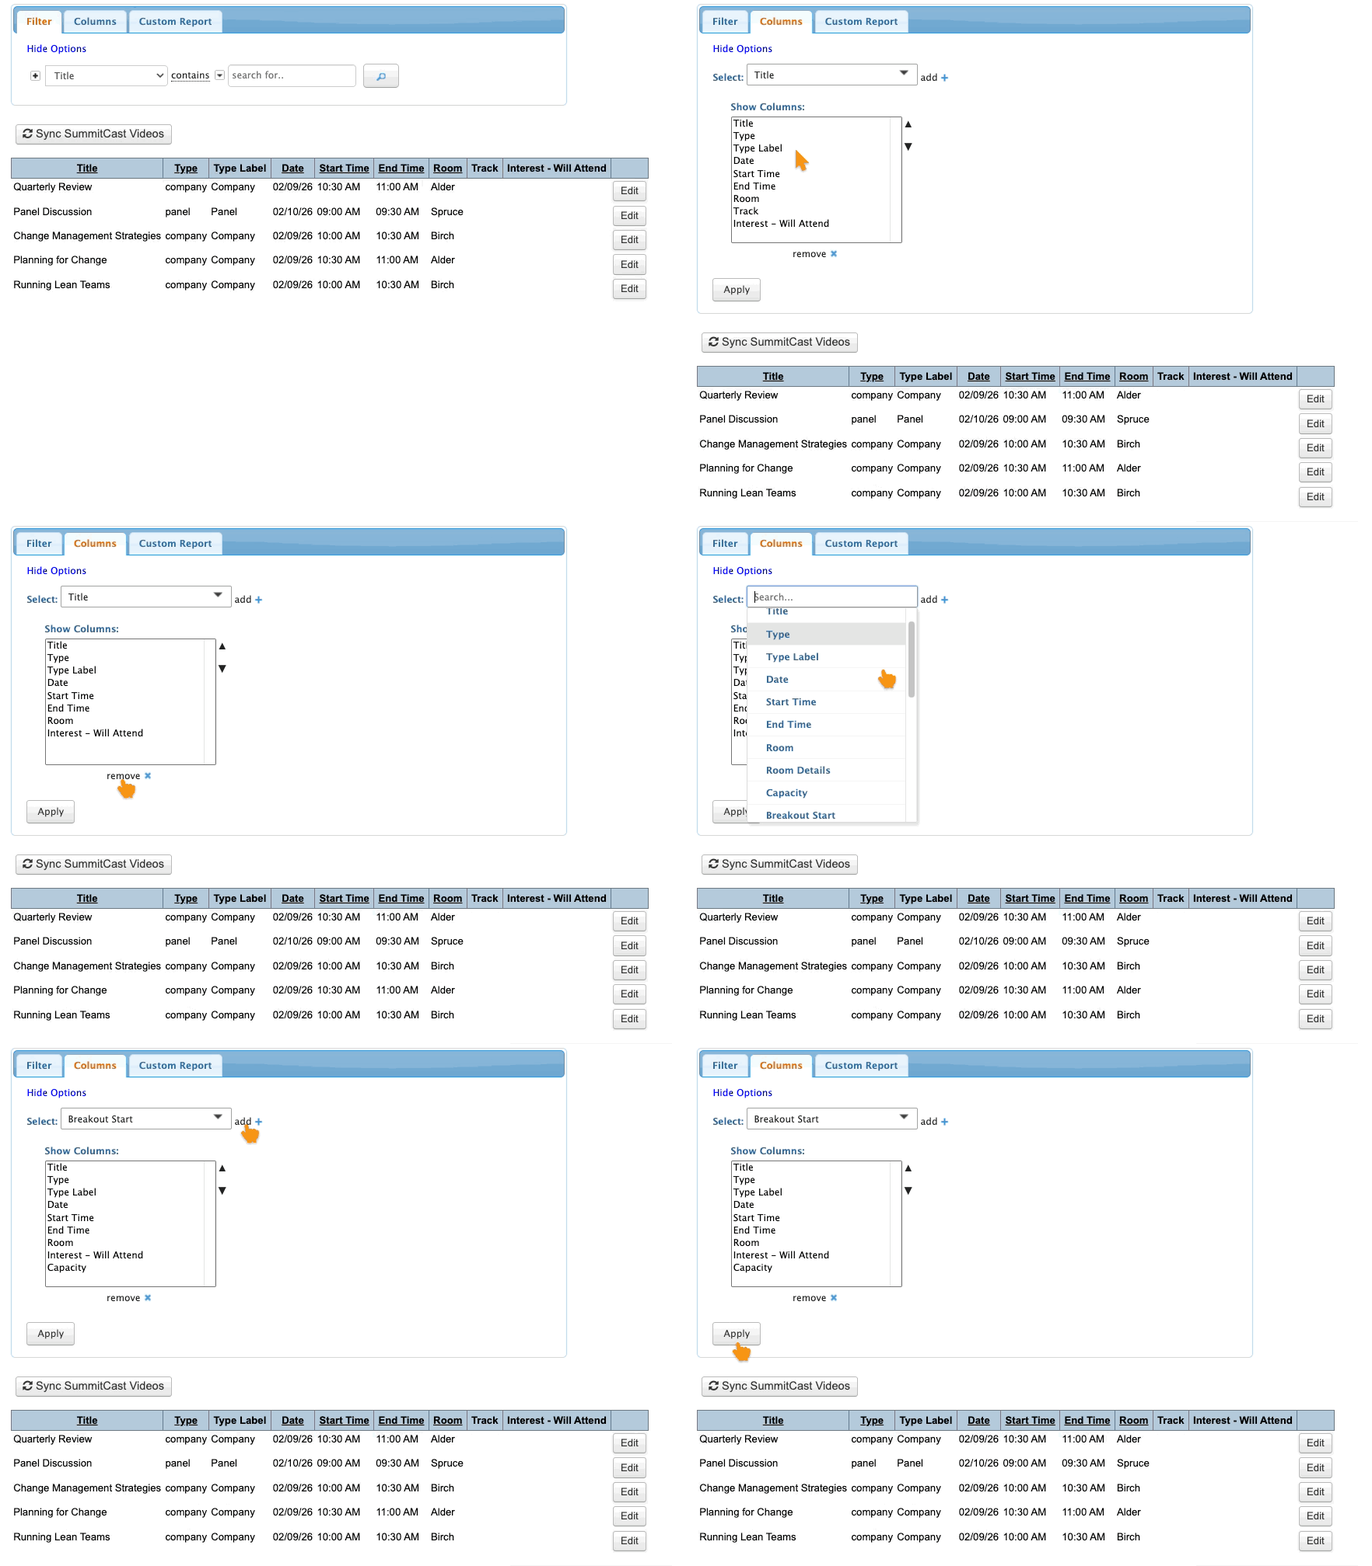
In the Columns tab, you can add and remove columns to make the list better fit your needs:

Reordering columns
You can arrange the columns of your list in any order that meets your needs. In the Columns tab, choose any column. Use the arrows to move it wherever you need it:

Saving custom reports
Want to save your filtered view of these lists to access later?
Head to the Custom Report tab, and you can save this view as a report. Give it a title, choose whether to share it with your team, and click Save:

Once it’s saved, you can access your custom report any time. Head to the top right corner of the list and use the Load report menu:

Using the Presentation List
The Presentation List is a bit simpler in format. It helps you monitor things like:
- How many sessions each participant is presenting
- How many presentations have breakout sessions
- If you’re using multiple presentation tracks, you can see an overview of each track.
- How many Attendees have indicated interest in each presentation
With this information, you can make sure there’s enough space and seating for every presentation:

Finally, the Presentation List has an Edit button for every presentation, so you have an easy way to make updates:

Using the Presenter List
The Presenter List has more available fields, so you can build more complex reports from it.
It’s a useful list for things like:
- Tracking how many presenters you have on your schedule from each company
- Seeing which presenters are moderators
- Creating a cellphone list for presenters in case you need to reach them
- Seeing which presenters are also receiving 1x1 meeting requests
The Presenter List can also access all the same presentation details as the Presentation List, so you can use this data alongside Presenter information:

Exporting lists
While you’re displaying either list, head to the top right corner of the page. Click Excel to export the current view.
You can open the downloaded file in any spreadsheet software:


