Report: Total meeting requests vs. available time slots

How it’s used:
• This pair of reports gives you a quick, general snapshot of whether you can accommodate all of your event’s meeting requests.
• The availability and blackout times of individual participants will affect this picture somewhat. So think of this report as a simple overview.
• This report helps you see if you might need to increase the capacity of any of your meeting locations, to accommodate more meetings.
In this article:
Running the reports
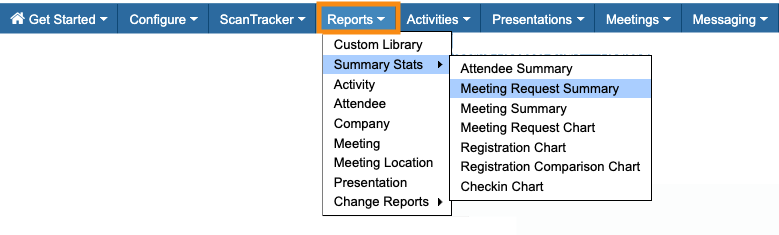
- Step 1. Head to the Reports tab. Choose Summary Stats, then Meeting Request Summary:
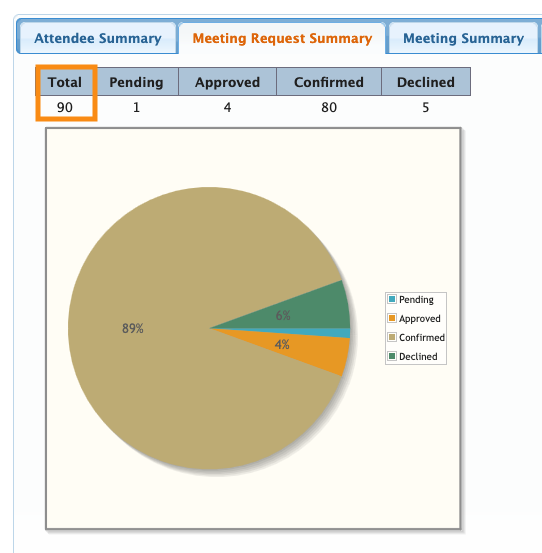
- Step 2. On the Summary page, you’ll see the current total number of meeting requests for your event. This page updates automatically as new requests are submitted:
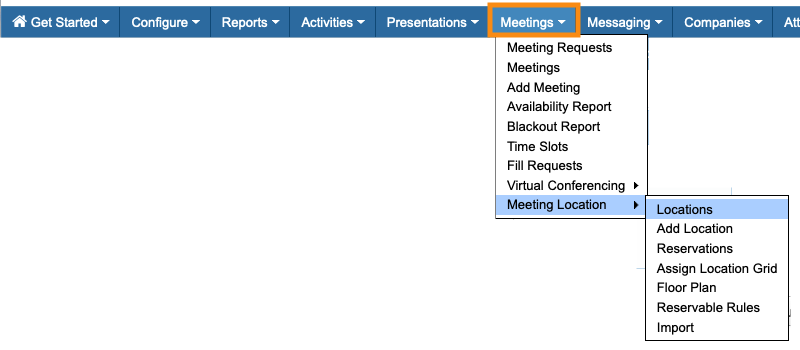
- Step 3. Next, head to the Meetings tab. Choose Meeting Location, then Locations:
- Step 4. On the Locations List, there’s a column showing the current total number of available time slots for each location. Here’s how that’s calculated:
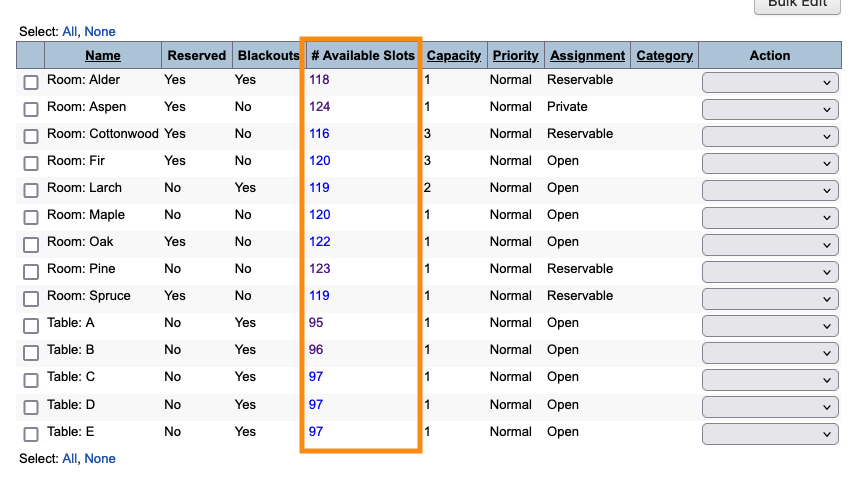
- To get the grand total of available time slots for your event, it’s easiest to export this list.
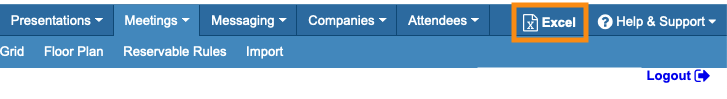
Exporting the report
To export the report in spreadsheet form, head to the top right corner of the page. Click Excel.
You can open the exported file in any spreadsheet software:
Once you have the report in a spreadsheet, you can run a SUM function to get the total number of available time slots.
Comparing the data
- If your Meeting Request total is less than your total Time Slots, you still have capacity to schedule meetings.
- If your Time Slots total is less than your total Meeting Requests, you don’t have enough capacity to schedule all the requested meetings.
- If the two totals are close, you’ll want to keep an eye on capacity as you’re scheduling meetings. Individual availability restrictions might cause you to need a bit more capacity, so you can accommodate every request.

